
We are excited to announce Inmanta Service Orchestrator 9.4, the latest minor release in the series. This release puts operators in control of exactly what they change. When deploying, only the services and resources that are of interest are used. When building models, the authors can align naming with the rest of the business so state is easier to understand at a glance. When compiling, execution takes up to 30% less time, depending on the model. All of this comes without any modeling changes compared to 9.3.
Key features at a glance
Targeted Deploy and Repair: act on a filtered set, a single service or resource, or the whole environment
Service lifecycles annotated with operator-friendly labels, icons and actions
Service forms with units, dependent suggestions and live GraphQL queries
A reworked Desired State tab and a new environment dashboard
Compiles up to 30% faster
Choose what you deploy
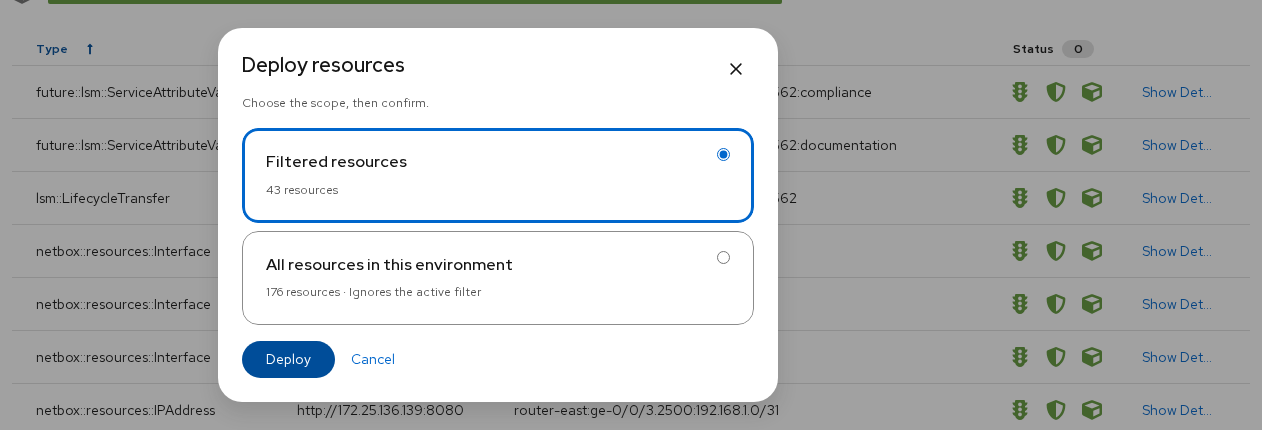
Until now, Deploy and Repair on the Resources page always acted on the whole environment. In 9.4 you choose: the resources you filtered on, a single service or resource, or the whole environment.
A single Deploy button runs an incremental deploy; its menu offers Repair, a full re-check.
Filter the Resources page, and the confirmation dialog lets you deploy just the filtered set or the whole environment, with the number of resources for each.
A new Service filter narrows the list to one service instance, optionally including the services it owns.
The same button is on every service instance and every resource.
Lifecycles that speak your language
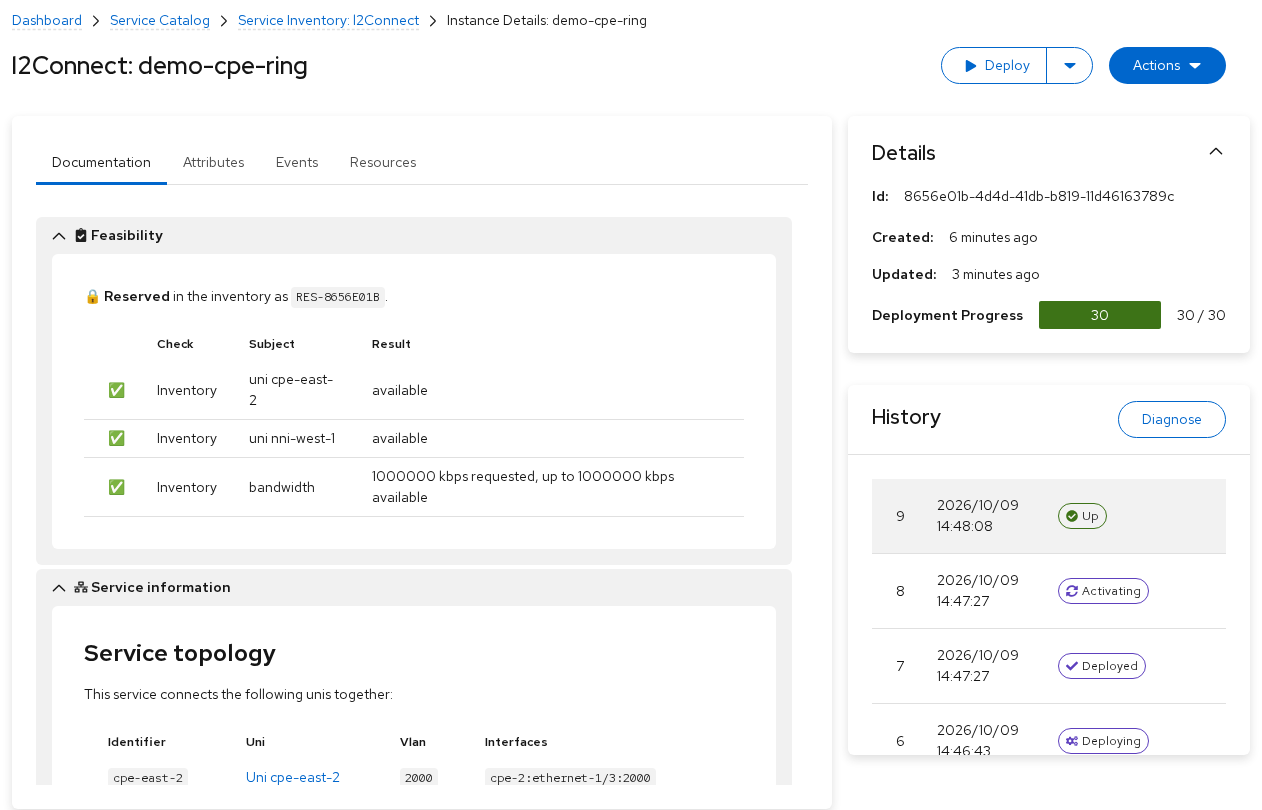
Service lifecycles are designed by model authors but used every day by operators. 9.4 lets authors annotate states and actions so the console speaks the operator's language.
States show a label and an icon, such as Deploying, Activating or Up, instead of internal names.
Actions appear as clear menu items, such as Enter maintenance or Repair, with their own icon and style.
Each action can carry its own confirmation question.
Rarely used or risky actions move into an Advanced section, one click away.
Service forms that understand your data
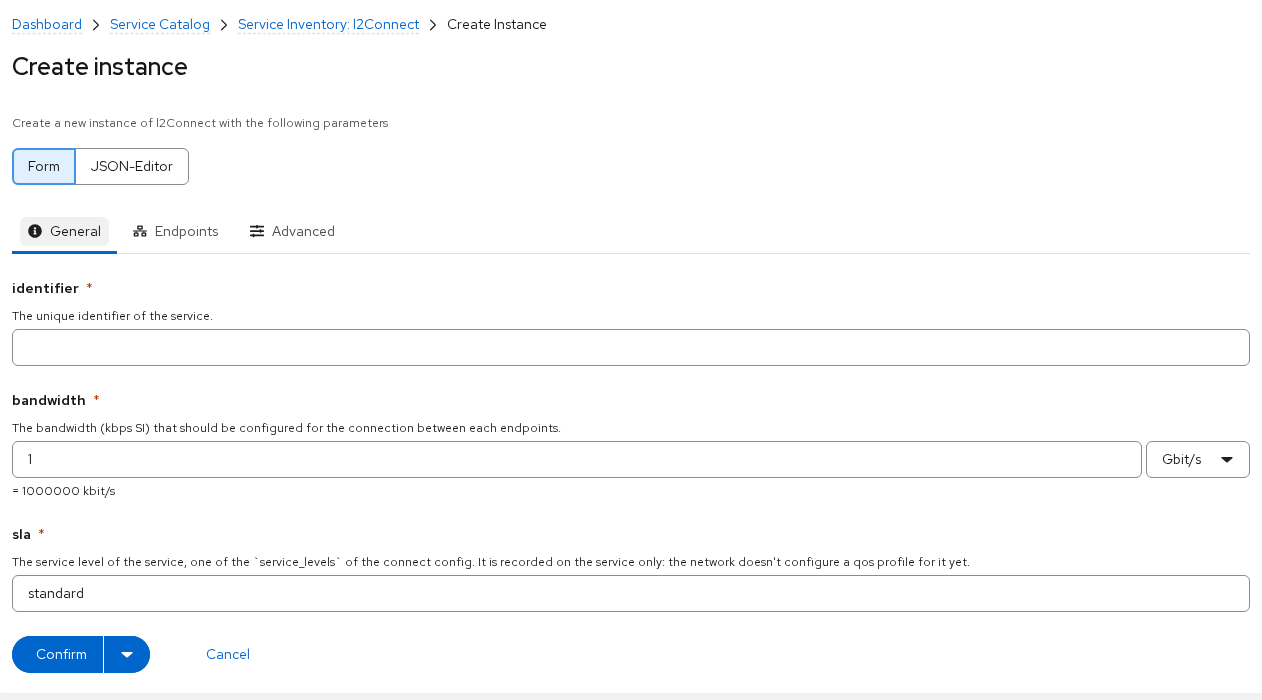
Service forms now handle the details operators would otherwise have to work out themselves.
Bandwidths, sizes and durations are entered with a unit, for example 1 Gbit/s, while the model keeps its own base unit.
Suggestions can depend on other fields: pick a site, and the list of uplinks narrows to that site.
Suggestions can come straight from a live GraphQL query on the orchestrator.
A reworked Desired State tab
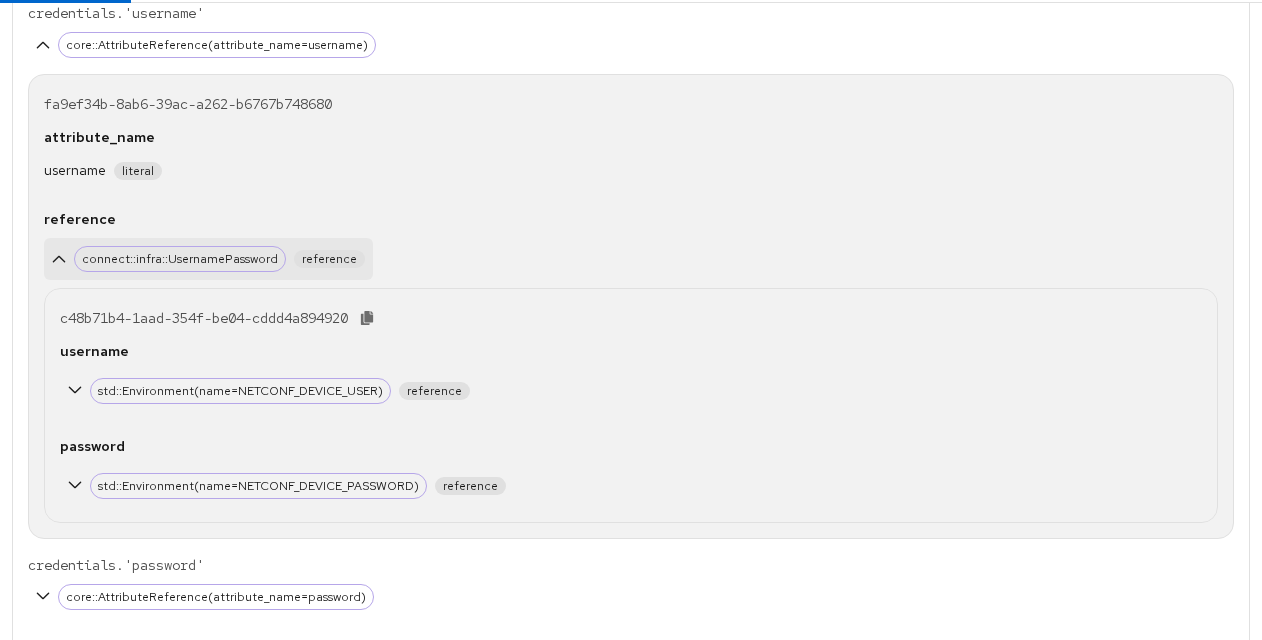
The Desired State tab has been rebuilt rebuilt with a clearer structure and a JSON view of the raw payload. It also shows where values such as credentials come from when they are resolved at deploy time, step by step. A value read from a fact links straight to that fact.
A new environment dashboard
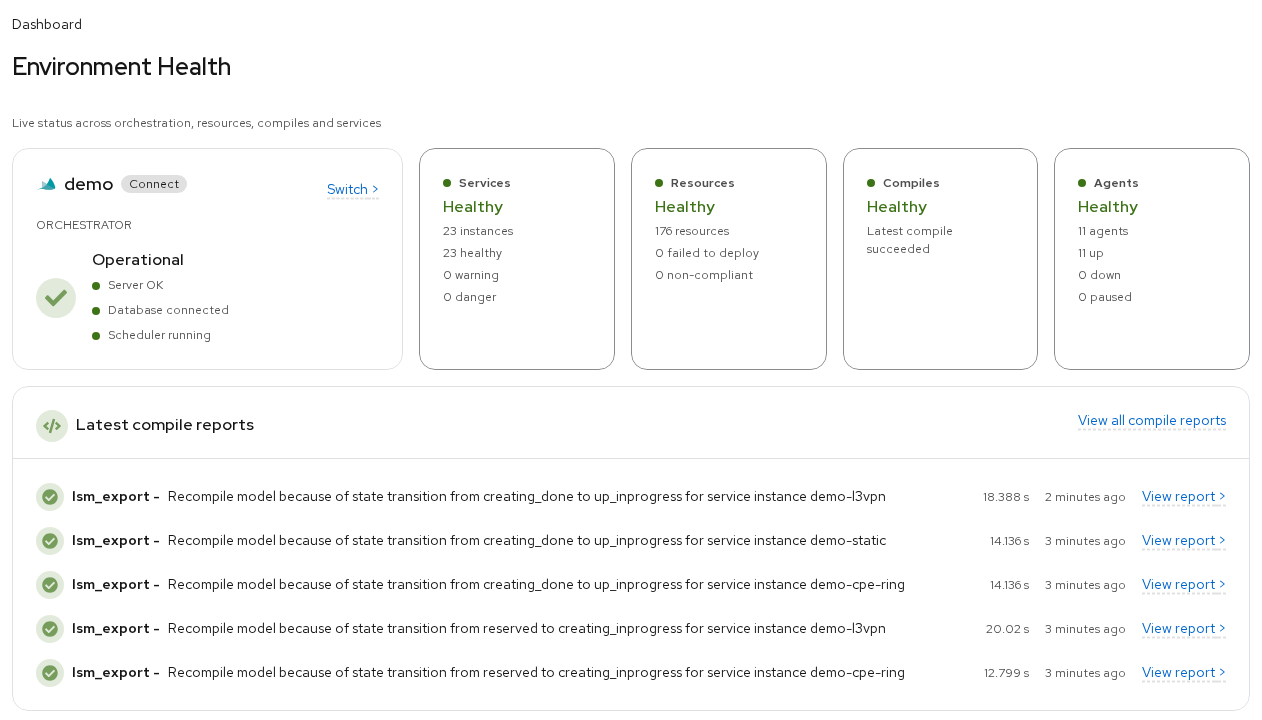
The dashboard now gives a live health check of the environment covering the orchestrator, services, resources, compiles and agents, with the latest compile reports underneath. The status icon in the header turns red when the server reports a problem.
Faster compiles
Compiles take up to 30% less time, depending on the model, on top of the compiler improvements introduced earlier in ISO 9. Large module sets also load faster from the parser cache.
Also in this release
The same side-panel filters on every list page, including Service Inventory, Compile Reports and Facts.
An Actions menu on the Agents page to pause or resume all agents at once.
Breadcrumbs and page titles stay in view while you scroll, and tables keep their page when you navigate back.
Inmanta Service Orchestrator 9.4 is available now. Read the detailed release notes and the changelog on docs.inmanta.com for the full list of changes and upgrade notes. Want to see 9.4 in action? Reach out to your Inmanta contact, or get in touch at inmanta.com/contact-us.
Stay up to date with upcoming releases by following us on LinkedIn.