
We are excited to announce Inmanta Service Orchestrator (ISO) 9, the next major release line of our orchestration platform. Release v9 is a substantial step forward across four major themes. Each of these themes below builds on architectural work that started with release v8. Some are direct follow-ons to the new deployment subsystem; others unlock capabilities that customers and partners have been asking for.
The sections below cover the highlights in detail. The current shipping version is v9.1.
Key features at a glance:
- Faster model evaluation: compiler, export, and scaling
- Richer resource status model with a redesigned resource view in the Web Console
- New compliance reporting and report-only resources
- Modernized OIDC authentication stack with PKCE and support for any standards-compliant provider
Faster model evaluation: compiler, export & scaling
Compiling and exporting large service models is measurably faster in the new release. The improvement can be seen across the board, but the impact is most significant for larger and more complex models
Optimized compiler. Core compilation of Inmanta service models has been reworked, with a focus on the cases where the compiler has to speculate, i.e. evaluate statements that depend on values not yet known and resume them as those values become available. This is exactly the work that dominates compile time on real-world service models, where attributes flow across many entities, and resolution order is non-trivial. Simple, fully-resolved models see modest gains; the larger and more complex the model, the bigger the speedup, with typical complex models seeing a 10–40% improvement and the heaviest models benefiting more.
- Backported to version 8.5.1. Most of the compiler improvements have also been backported to version 8.5.1, so customers staying on the 8.x line benefit immediately without needing to upgrade to version 9.
- More improvements on the way. Further compiler optimizations are already in the pipeline and will land in subsequent minor releases.
ISO 9 delivers a massive performance boost to partial compile, making the post-upload phase at least an order of magnitude faster across the board. While previous versions saw the work after the upload (i.e. committing the new version and getting the scheduler ready to act on it) grow sharply with the total number of resources managed by the orchestrator, this release ensures that scaling is now near-linear in the size of the change itself.

This directly reduces iteration time during service development and shortens the feedback loop on production deployments.
A new resource status model and resource view
The Resources view has been reworked from the ground up. The previous single-field state was overloaded, trying to convey several dimensions of information in one field. Version 9 splits the resource state into its component status fields, each answering a different question.
Building on the Inmanta Service Orchestrator 8 deployment architecture
This is the next step in the architectural rework that started with the previous major release , in which the deployment subsystem was rewritten from scratch and split into three processes:
- The API server (northbound APIs and intent decomposition),
- A per-environment resource scheduler (the central coordinator for enforcement, compliance checking, repair, and dry-run), and
- On-demand short-lived executor processes (which allow multiple versions of adapters to be loaded side-by-side and let deployments use multiple cores).
That redesign was framed at the time as unlocking scalability and opening future possibilities.
The new resource status model is one of those follow-ons. With the scheduler now centralizing every decision about a resource — should we deploy?, did the last attempt succeed?, is the intent still current?, are we waiting on something? — it has internal state that the old single-axis API simply could not represent. This release surfaces that richer state directly. The four axes described below are the questions the scheduler is already answering, finally exposed end-to-end through the GraphQL API and the web console.
Further work along the same trajectory is planned forfuture releases (including the deprecation of the undefined / blocked notions, see Future direction below).
A note on terminology
The descriptions below use a few core Inmanta concepts that are worth restating up front:
- Resource — something we manage. A resource has an intent (its desired state) and the orchestrator's job is to make the real world reflect that intent.
- Handler — a Python class that knows how to read from and write to the real world (a router, a switch, a server, an API). It receives a resource's intent from the orchestrator and enforces it.
- Handler run — invoking the handler against a resource's intent, either to bring the real world in line with the resource's current intent or perform a compliance check.
Why the split was needed
If every deploy was instantaneous, a single field could plausibly carry the full state. In practice, the time between an intent change and the handler finishing can range from milliseconds to hours. During that window, important information was being hidden by the legacy single field:
- The legacy available state meant "the resource has new intent" — but it hid whether previous deploys for that resource had succeeded. The most relevant predictor of how the next deploy will go was no longer visible.
- The legacy deploying state hid the fact that the resource may have been perfectly healthy a moment before. A repair on a compliant resource looked the same as a deploy attempt on a broken one.
- The fix is to tease the resource state apart into multiple axes whose values are distinct, so no axis hides another. As a side benefit, each stakeholder now sees only the dimensions it cares about: handler health and intent enforcement are different questions, asked by different stakeholders.
The two primary axes
Compliance — does the real world match the latest intent for this resource? 🛡️
|
Value
|
Meaning
|
|
compliant
|
We have reason to believe the real world matches the latest intent. Derived from a successful handler result; reset when the intent is updated.
|
|
non_compliant
|
We have reason to believe the real world does not match the intent. Set on a handler failure, or when a report-only handler observes drift.
|
|
has_update
|
A special form of non-compliance: the intent was updated since the last handler run. We expect a mismatch, but only because we haven't tried to enforce yet. A resource whose last_handler_run is new is always in has_update.
|
|
undefined
|
A special form of has_update: the exact intent isn't fully known yet (an unknown attribute), so it can't be sent to the handler. Always implies blocked.
|
Last handler run — what did the handler do the last time it ran? 📦
|
Value
|
Meaning
|
|
new
|
The handler has never finished a run for this resource — perhaps it is queued, perhaps it is running right now and taking a while.
|
|
successful
|
The handler finished successfully. In most cases this means the intent was enforced; the exception is report-only resources, where the handler may succeed but report drift, leaving compliance at non_compliant.
|
|
failed
|
Something went unexpectedly wrong — a communication error with a device, an uncaught exception in handler code, or similar.
|
|
skipped
|
The handler decided it was not (yet) ready to process the resource. Most commonly this happens when a dependency is in a failed state (e.g. you can't write a file to a VM until the VM exists).
|
Compliance is the primary field, with last_handler_run a close second. The two answer related but distinct questions: compliance is about the latest intent being enforced in the real world, while last_handler_run is a health check of the handler itself, and is not overwritten when the intent updates.
Two additional axes
is_deploying — is a handler running right now? 🟢
A boolean indicating that a handler invocation is in flight for this resource. It is a separate axis so the UI can tell the user "a deploy is happening" without overwriting the answer to "is the intent currently enforced?". This is what lets a compliant resource that is being periodically re-checked still be reported as compliant during the check, instead of switching to a deploying state that erases its history.
Blocked — can we send this resource to the handler at all? 🚦
|
Value
|
Meaning
|
|
not_blocked
|
The orchestrator can act on this resource.
|
|
blocked
|
The resource cannot be sent to the handler — either it is itself undefined, or it transitively depends on something that is. Will not recover within the current model version; only a new compile+export can resolve it.
|
Concrete examples
- Intent update on a previously healthy resource. New intent is pushed → compliance: has_update, last_handler_run: successful (still — the previous handler run is real history, not erased). Once the handler finishes the new run, compliance becomes compliant or non_compliant and last_handler_run is updated to reflect what just happened.
- Repair on a compliant resource. The orchestrator periodically re-deploys to confirm intent is still enforced. During the run: compliance: compliant, is_deploying: true. If the run succeeds, both fields keep their meaning and is_deploying simply flips to false. If something breaks, compliance flips to non_compliant and last_handler_run to failed.
- Report-only resource detecting drift. The handler runs, finds the real world has drifted, but is not allowed to remediate. Result: last_handler_run: successful (the run itself was fine), compliance: non_compliant. A resource can be non-compliant even if its handler is healthy — exactly the signal compliance reporting is built around.
- Undefined intent. A new compile leaves an attribute unknown → compliance: undefined, blocked: blocked. Any resource that transitively depends on this one also becomes blocked. None of them are sent to the handler until a subsequent compile+export resolves the unknown.
Future direction
The undefined / blocked concepts are expected to be deprecated in ISO 10 and removed in ISO 11, simplifying the model further once the underlying scheduling work allows it.
API surface
This major release represents a substantial investment in GraphQL as the primary read API for orchestrator state. Where the legacy REST endpoints typically returned a fixed shape and required users to fetch broadly and post-process, the GraphQL layer is built to support complex queries and transformations server-side: users can ask for exactly the fields they need across multiple resources at once, combine filters across the new state axes (compliance, blocked, last handler run, deploying, orphan), aggregate into per-axis histograms, and join through related entities — all in a single round-trip and with predictable shape. This is what makes the new web-console views responsive at hundreds of thousands of resources, and what makes integrations (compliance dashboards, custom CMDB feeds, automation glue) substantially easier to build without bespoke server-side endpoints.
Concrete additions on the resource-state side:
- resource_summary GraphQL query. Returns a ComposedResourceSummary that is a histogram per axis: compliance, blocked, last_handler_run, and is_deploying. This is exactly what powers the four counts and the stacked status bars at the top of the new Resources page.
- Per-resource compliance. A ResourceComplianceDiff model exposes per-resource state (compliance, last_handler_run, last_handler_run_at, attribute diff, and a report_only flag), with timestamps so the UI can show how fresh each axis is.
- Persistent state via GraphQL. The resource_persistent_state table is mapped through the GraphQL schema, exposing the raw fields (blocked, last_handler_run, is_orphan, is_undefined).
- GraphQL variables are supported on all queries, so saved/parameterized client queries no longer have to do string interpolation.
- A GraphiQL editor ships embedded in the web console, so operators and integrators can explore the schema and prototype queries without seting up external tooling.
Web Console
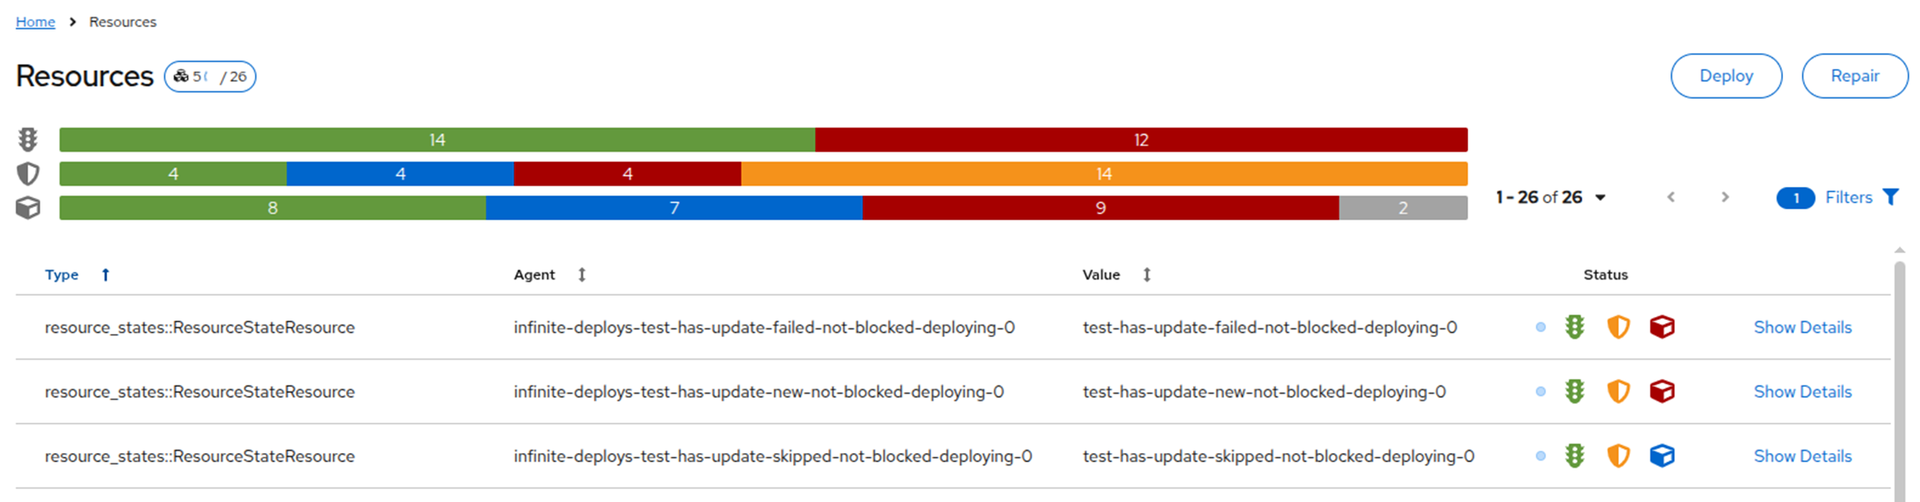
Per-resource status icons: The Resources page renders the three icons (traffic light / shield / cube) per resource, with hover-cards giving a "Resource State Summary" — last deploy timestamp, requirement count, and the value on each axis.
Environment-wide status bars: Three stacked horizontal bars at the top of the page show the per-axis distribution across the entire environment, with click-to-filter behavior.
Reworked filter UI:Filters can now be combined freely across compliance, last handler run, blocked, deploying, and orphan status, and the new control surfaces every axis directly instead of forcing users to map their question onto the legacy single-field state. The same filter framework is reused across other resource views, so the experience is consistent everywhere resources are listed.
The Resources page: three stacked status bars at the top (one per state axis — traffic light, shield, cube) show the environment-wide distribution; per-row status icons on the right give the same view per resource.
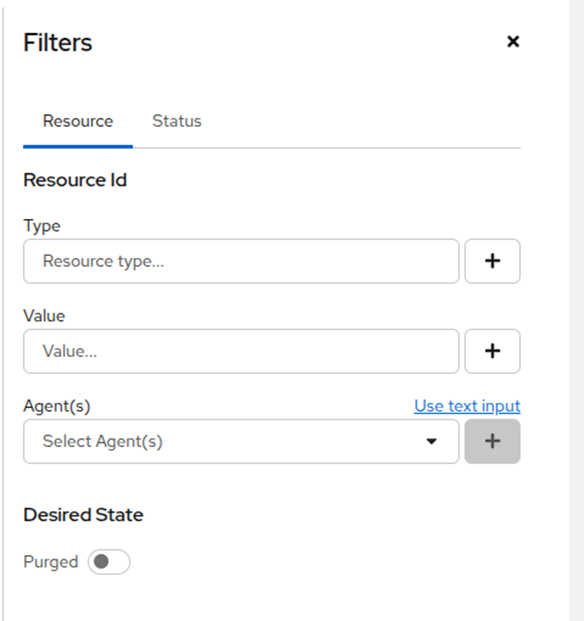
The reworked filter UI — Resource tab with type / value / agent / purged controls.
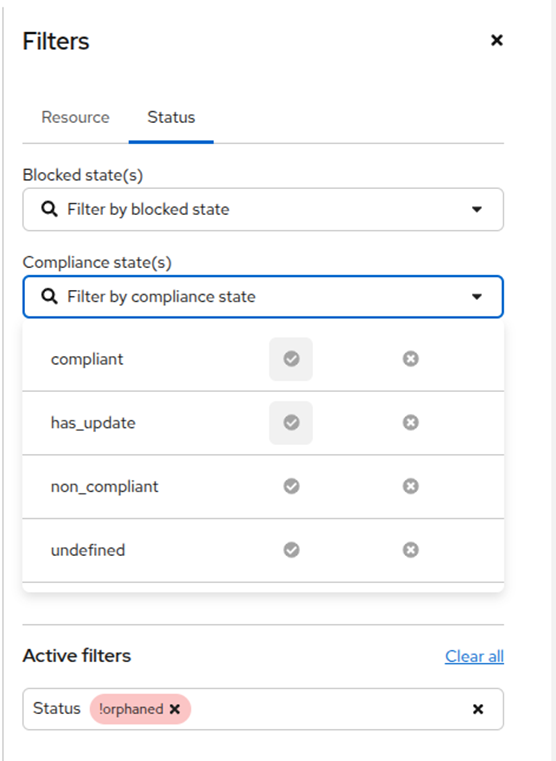
The reworked filter UI — Status tab combines filters across the new state axes; here a Compliance dropdown shows the four values (compliant, has_update, non_compliant, undefined) with include/exclude controls, and an Active filters pill excludes orphans.
Orphan handling: Resources view distinguishes between resources that are part of the latest intent and orphans — resources we managed in the past but no longer manage. Orphans can also be older versions of resources still under management. They are essentially log/history entries: useful for forensics, but not currently relevant to the user's environment.
For orphans, most of the new state axes are not meaningful and may return null (a resource that is not part of the current intent has no current compliance status, no current "blocked" answer). The Resources page therefore filters orphans out by default; the user can opt them in via the filter, and the UI greys out the per-axis icons for orphan rows.
Backwards compatibility
Existing API endpoints continue to report on the legacy single-axis
resource state, so clients that have not yet migrated to the new model keep
working without changes. The multi-axis state is exposed alongside it through
GraphQL. In future releases these states will also be exposed in other places
such as handlers.
Compliance reporting and report-only resources
A new resource mode enables "observe, don't enforce" workflows for compliance and audit use cases. The orchestrator becomes the source of truth for intent; remediation is then driven by humans, external systems, or explicit lifecycle transfers.
Licensing: compliance reporting is a licensed add-on and requires a license update. Existing customers should contact their Inmanta sales contact before enabling it in production.
Without the license, the feature is simply inert: report-only resources behave like regular resources in dry-run mode. Any non-compliance signal a handler emits is surfaced as a plain failed outcome rather than non_compliant. Upgrading to version 9 without the license therefore does not break anything — you just don't get the new compliance behavior.
This feature has been running as a technical preview at customers for several months ahead of the general-availability release , and customer feedback shaped the final design — particularly around how non-compliance interacts with LSM lifecycles and the order API.
A change in philosophy: stop auto-enforcing on drift
For most of Inmanta's history the contract has been simple. If the real world drifts from intent, the orchestrator pulls it back. Automatically.
Report-only resources break that contract on purpose. They let you tell the orchestrator "observe and tell me, don't fix it". The use cases: compliance audits, brownfield onboarding, change-controlled environments, anything where remediation needs human or external-system approval.
That power comes with a cost. While a resource is non-compliant and not being enforced, dependent updates are queued. The orchestrator will not roll forward over a known-non-compliant predecessor. New intent stays pending. It resumes when either the operator authorizes enforcement, or the lifecycle takes a non-compliance transfer that unblocks dependent work.
This is an intentional trade-off. Observability without auto-enforcement means an operator stays in the loop. It is the change that most directly affects day-to-day operations on services using report-only mode, so it is worth setting expectations up front.
What's new
- Report-only resources. Resources can now be declared as report-only via a boolean field on the resource. The handler reads the actual state and reports the diff against desired state, but never writes. A report-only resource that drifts, goes to the non_compliant state — distinct from failed. Report-only mode can also be controlled from the lifecycle in a similar manner like purged or other service states.
- Compliance-aware lifecycles in LSM. lsm::StateTransfer gains a third edge type alongside target and error: a non-compliance edge, e.g. lsm::StateTransfer(resource_based=true, target=x, error=y, non_compliant=z). Lifecycles can now react differently to "something failed" vs. "the network drifted from intent". The state-machine graph renders non-compliance edges in yellow.
- Backwards compatible. Lifecycles that only declare an error edge keep working: a non-compliant required resource produces an implicit self-loop (the service hangs in its current state), with the user alerted to the blocking non-compliant resource.
- Compliance report API. A new POST /api/v2/compliance_report endpoint produces a structured compliance report over an arbitrary scope, suitable for integration with external audit, ITSM, and reporting tools.
- Onboarding lifecycle. Inmanta Connect ships a lifecycle with report-only mode end-to-end,
useful as a template for greenfield onboarding flows where you want to observe
before enforcing.
Compliance panes per service instance
If "operator stays in the loop" is the new contract, operators need somewhere to look. The plumbing for per-service-instance compliance panes is available today in the future module, and gives model authors the building blocks to surface a live, per-instance compliance report directly inside the Web Console view of a service instance:
- A future::std::ResourceCompliance resource listens to deploy events from resources in its requires list and exposes their current compliance in its facts.
- A chain of references shapes that raw status into something operator-friendly
- A future::lsm::ServiceAttributeValue resource writes the rendered report into a service-instance attribute, so the report shows up as content on that service instance.
- A default markdown template ships in the module: a stats table, a Warning resources section (unexpected compliance or non-compliance — the things an operator should actually look at), and a Non-compliant resources section (expected diffs shown for visibility, not action). Combined with the setState button support in markdown that ships in the web console, the same pane can carry the buttons that authorize enforcement or drive a lifecycle transfer — closing the human-in-the-loop story.
These pieces will move into the appropriate core modules in subsequent releases.
Improved authentication and authorization
Authentication and authorization have both been modernized in this major release. Authentication is who you are, authorization is what you are allowed to do — they are separate concerns and release 9 advances both at the same time.
OIDC: PKCE and any provider
- New generic OIDC provider with PKCE. A new Web Console auth provider (auth method "oidc-generic") uses oidc-client-ts + react-oidc-context to implement the OAuth 2.0 authorization code flow with PKCE — the current IETF best practice for browser-based clients. The legacy Keycloak provider (auth method "oidc", based on keycloak-js + implicit flow) is kept in parallel for backwards compatibility.
- Any OIDC provider. The new provider is IdP-agnostic and has been validated against Microsoft Entra ID, Authentik, Keycloak, Okta and Auth0. Any standards-compliant OIDC IdP is supported.
- No custom claim required. Tokens do not need to carry the urn:inmanta:ct claim — inmanta-core now defaults to client type "api" when the claim is missing. This is what makes providers like MS Entra ID, which do not easily support custom claims, work out of the box.
- Simplified configuration. Two new config options drive the new flow: [web-ui] oidc_authority (setting it switches the console to the new generic provider) and [web-ui] oidc_scope (default openid profile email). The orchestrator's auth_jwt_* block stays IdP-agnostic — just point it at your issuer, audience and JWKS URI.
- Config generation. The server can generate a ready-to-use OIDC configuration for generic providers (including MS Entra ID), simplifying rollout.
- JWT auth config via environment variables. JWT auth options can now be supplied as environment variables, which plays nicely with containerized and GitOps-managed deployments. The underlying AuthJWTConfig has also been made thread-safe.
Login flow against an external OIDC provider, using the new generic provider with PKCE:
Policy-based authorization
The authorization side has historically been coarse-grained — a small set of hard-coded role checks. This version introduces a pluggable authorization framework with a new policy-engine provider built on top of Open Policy Agent, letting administrators express access rules as a declarative policy file instead of relying on baked-in role logic.
- Two providers, selectable per server. A new server.authorization-provider config option chooses between policy-engine (the new OPA-backed provider) and legacy (the existing coarse-grained checks). Default is legacy, so upgrades keep working unchanged; opt-in via the config option.
- Decisions driven by policy, not hard-coded roles. When the policy-engine provider is enabled, the server starts an embedded OPA instance. Every end-user API call is evaluated against the policy, with three pieces of information available to the rules: the decoded access token (claims, groups, etc.), the API call parameters (path/query/body), and per-endpoint metadata the server publishes — client_types, an auth_label that groups related endpoints (e.g. project.read), read_only, and the environment_param (the call's environment id). The auth_label mechanism in particular lets policies stay short and structured without enumerating individual endpoints.
- Default policy ships. A reasonable default access policy is included so the feature is usable out of the box; customers can replace it or extend it.
- Discovery tooling. A new inmanta policy-engine print-endpoint-data command dumps the full endpoint metadata, so policy authors can see exactly what is available to write rules against.
- Machine-to-machine traffic uses legacy. Calls with compiler or agent client types are always evaluated by the legacy provider, regardless of the configured authorization provider — so internal orchestrator traffic does not depend on user-side policy correctness.
- Auditing. Policy decisions are logged at INFO to policy-engine.log with the inputs that produced them, making it possible to debug "why was I allowed / denied?" without re-running the request.
Inmanta Service Orchestrator 9 is available now. For full changelogs, upgrade guides, and documentation, visit docs.inmanta.com. Questions about the compliance reporting add-on or any other feature? Reach out to your Inmanta contact, or get in touch at inmanta.com/contact-us.
Stay up to date with upcoming releases by following us on LinkedIn and subscribing to our newsletter.